Storm: A Probabilistic

Model Checking Tool

A fully automatic, scalable, and state-of-the-art tool that is based on dynamic fault trees (DFT) and event trees and, thus, can faithfully assess the risk of fail-operational/fault-tolerant dynamic systems with decision-making capabilities. It is equally competitive with existing commercial tools (for static fault trees analysis), but offers more flexible modeling and analyses, going beyond the capabilities of other tools, of dynamic systems as it covers all DFT gates.

Laptop with website preview
FREE
for
Academia

Storm Features Overview

Faithful modeling and analysis of complex systems

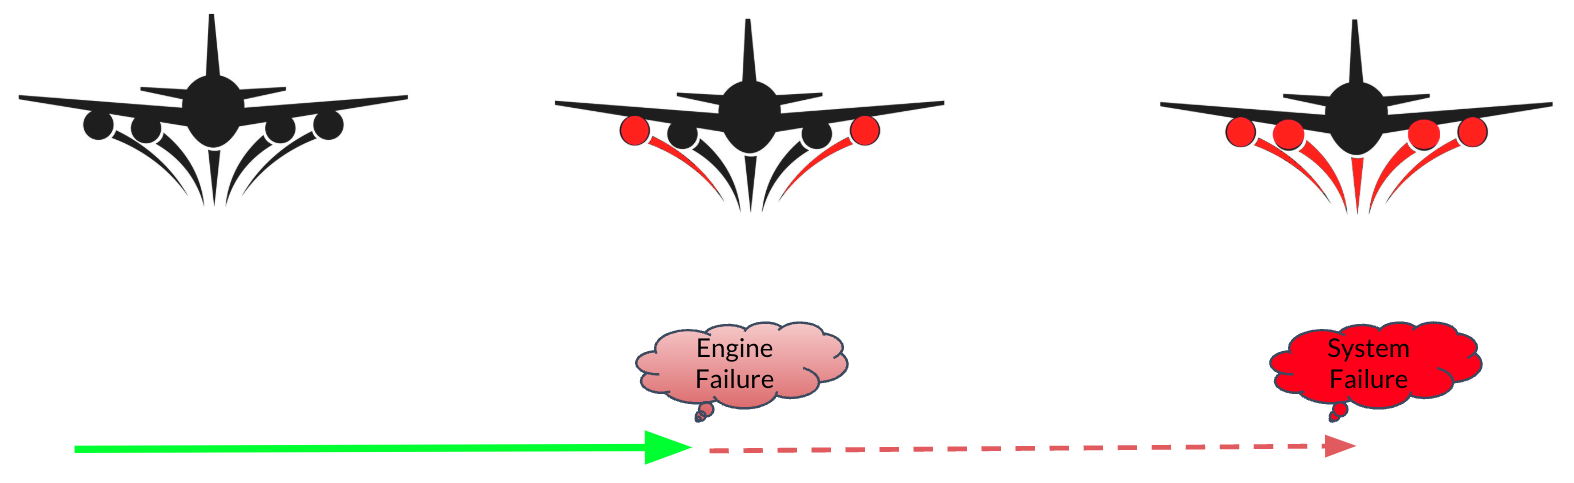
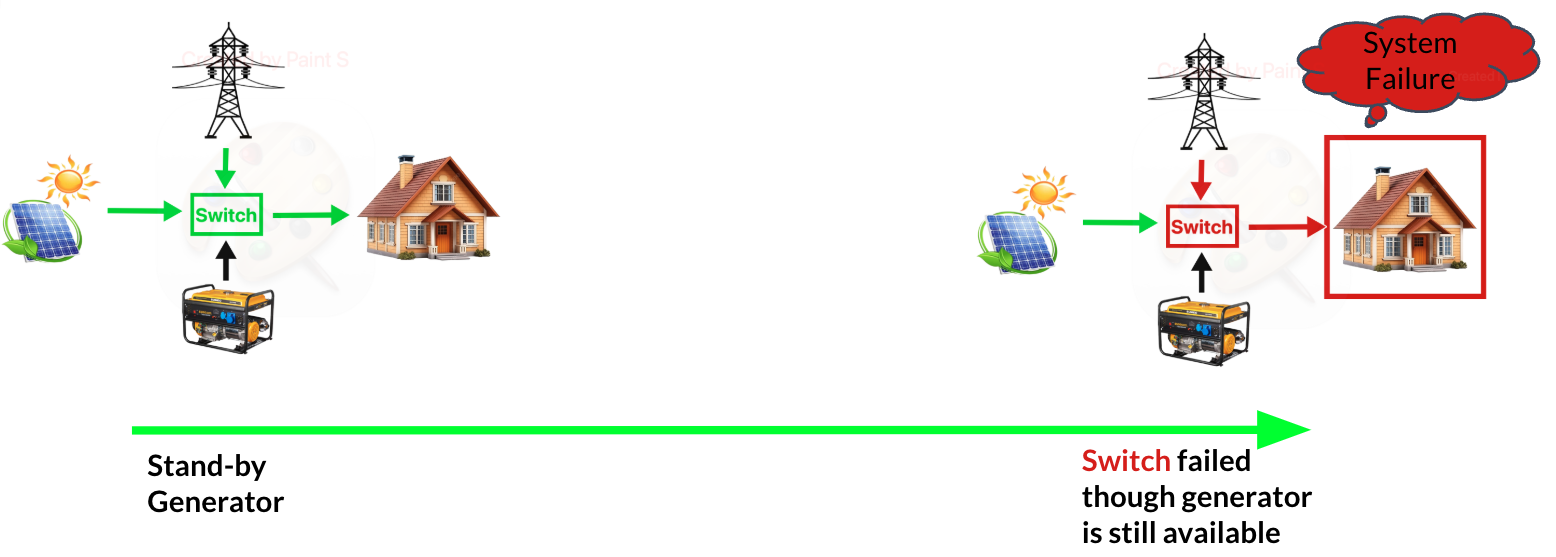
In order to accurately model large systems with redundancies, (probabilistic) functional dependencies, and temporal ordering among malfunctioning components—such as power plants, railroads, drones, medical equipment, satellites, and self-driving cars—static fault trees are too simplistic a formalism.

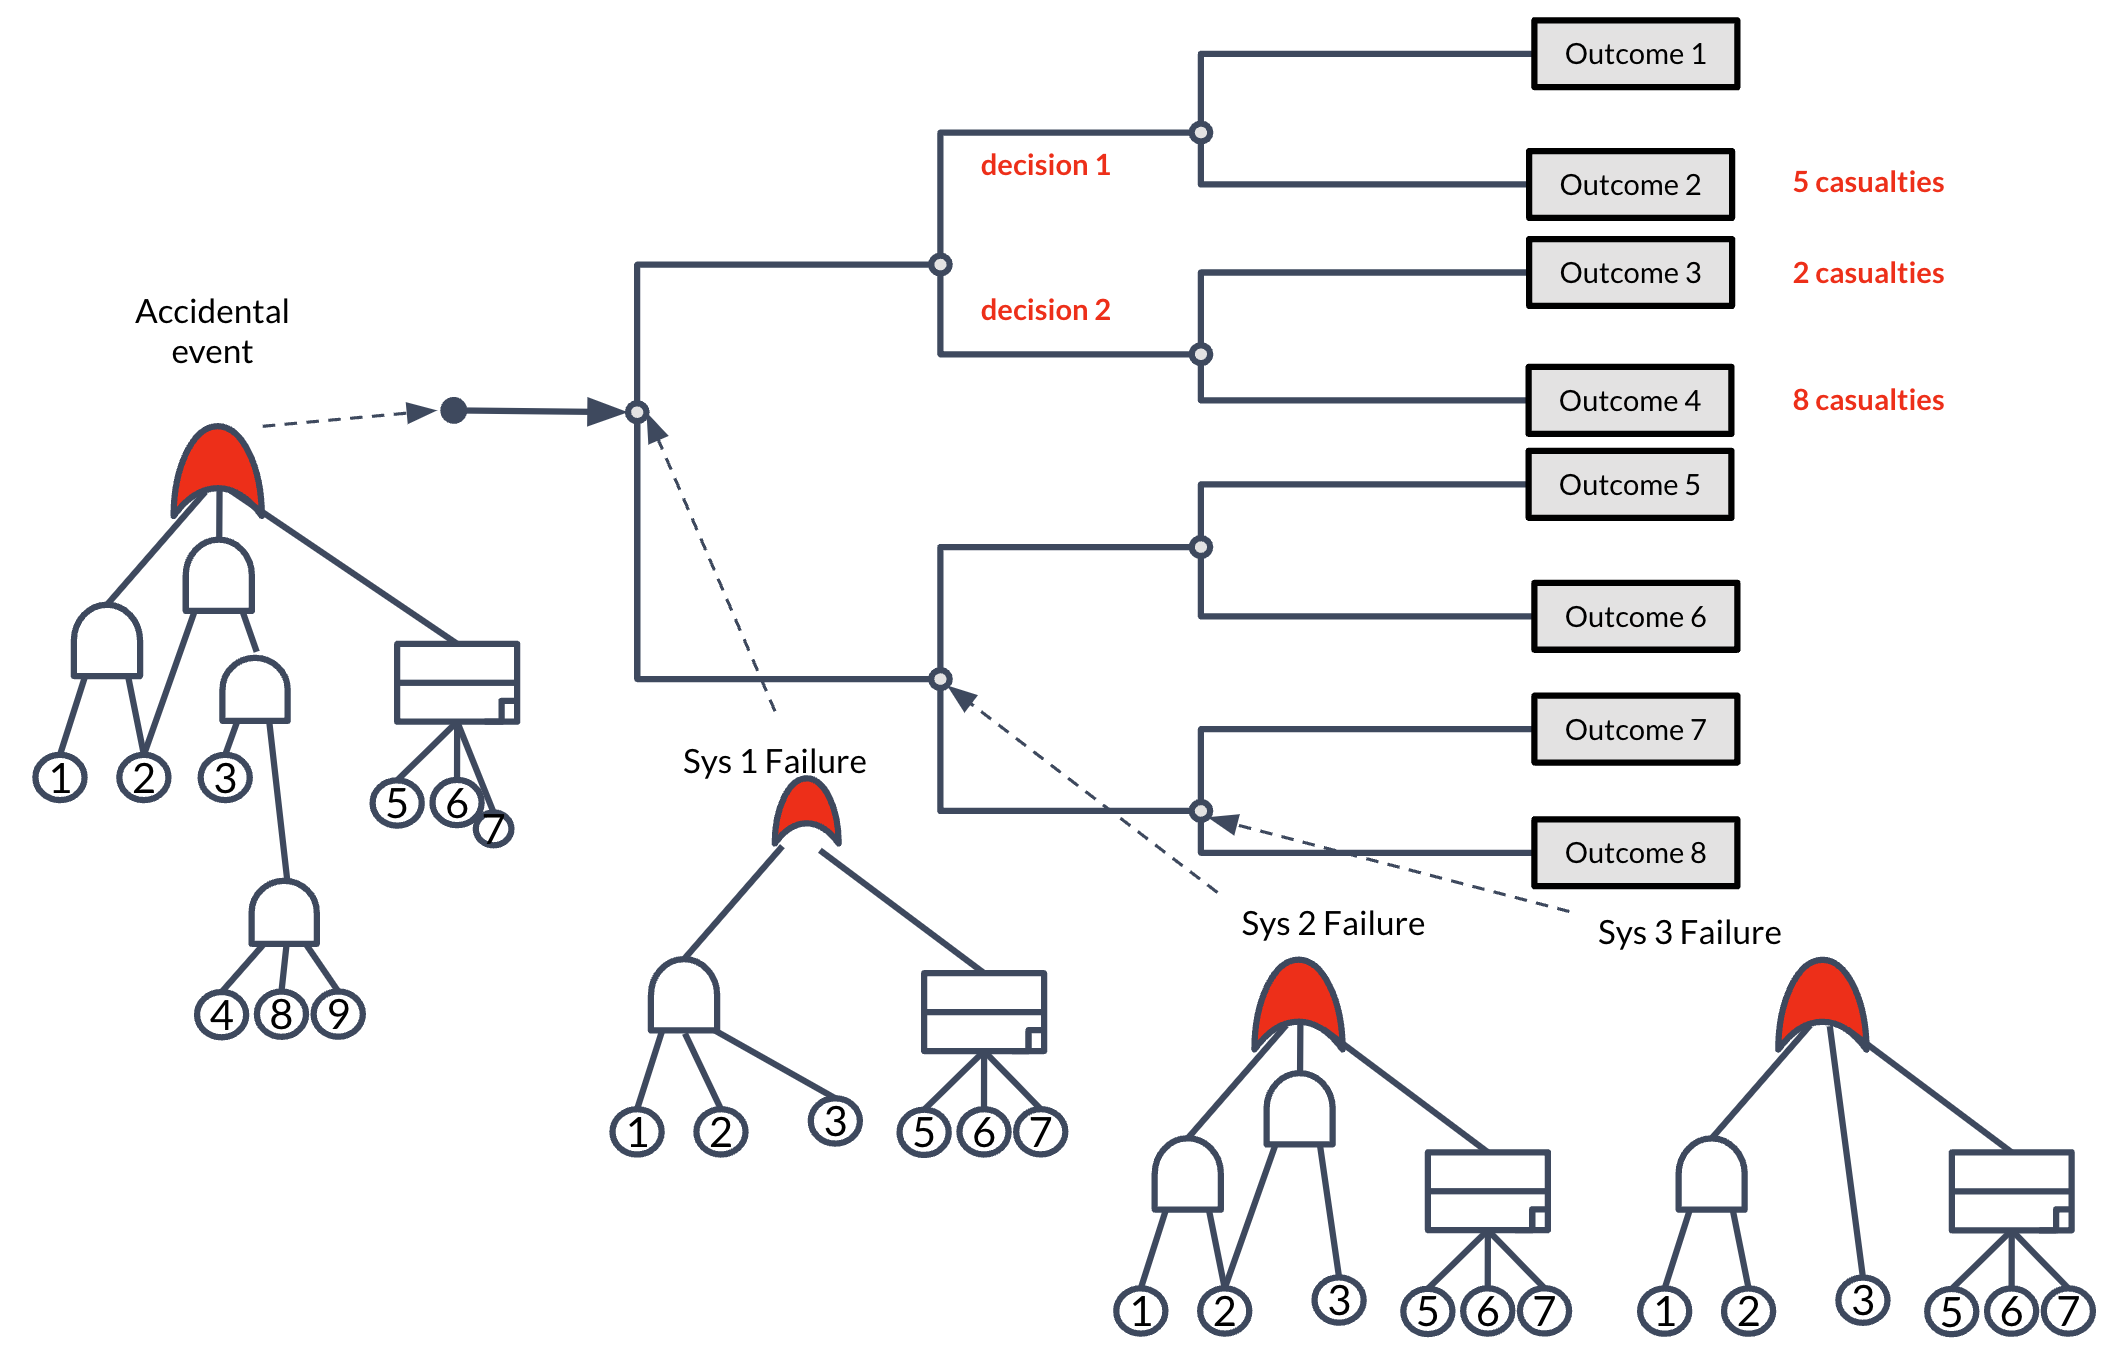
Similarly, event trees are unable to quantify losses such as the number of injuries, monetary loss, etc., or represent, for example, operators’ judgments following an accident, which may be necessary to lessen the impact of severe repercussions.

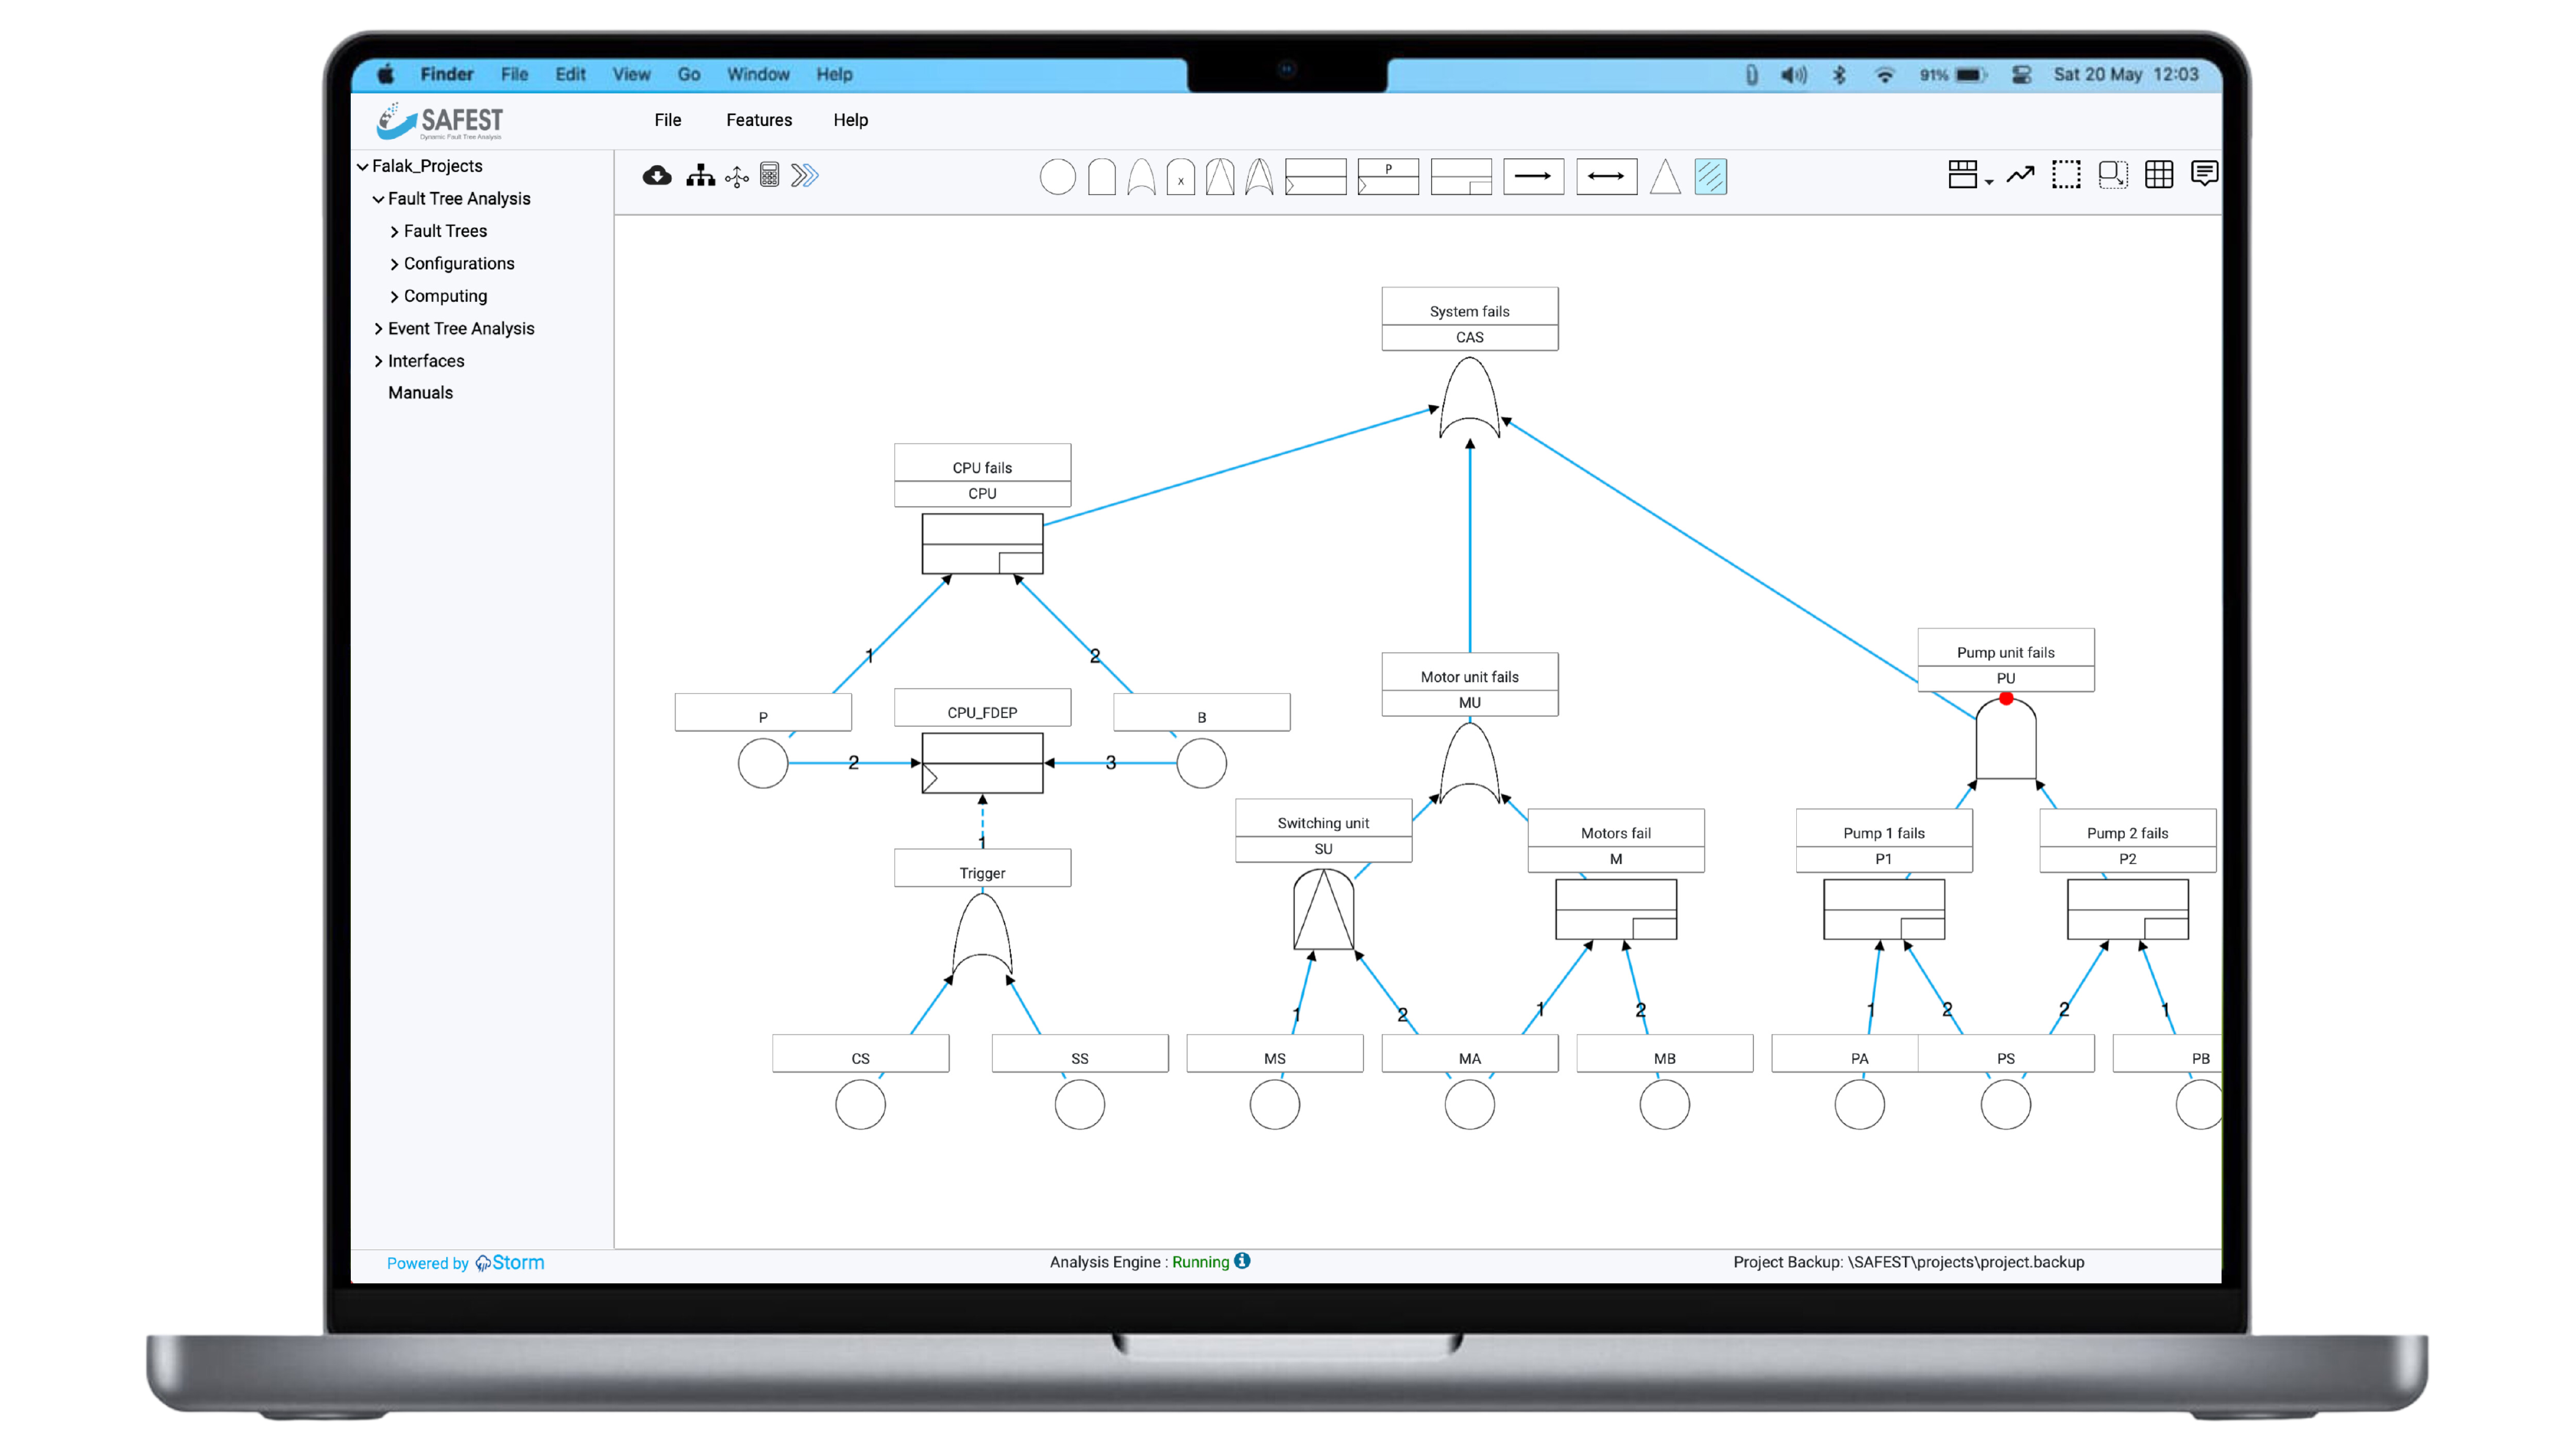
Dynamic fault trees and event trees overcome the above-mentioned shortcomings and, thus, enable the modeling and analysis of fail-operational/fault-tolerant dynamic systems.

Structure knowledge example

A tool for compliance with safety standards of high-tech industries

Storm is a unique tool that allows probabilistic risk assessments of complex dynamic systems, which is required by high-tech agencies like NASA, ESA, the Federal Aviation Authority (FAA), and the Nuclear Regulatory Commission (NRC). Additionally, it aids in fulfilling the requirements of global standards like ISO 26262, which demands rigorous risk assessment in the automotive industry:

ISO 26262 Logo
  • Metrics are verifiable and precise enough to differentiate between different system architectures.
  • [For systems where the] concept is based on redundant safety mechanisms, multiple-point failures of a higher order than two are considered in the analysis.

Specification (CSL logic) & quantification of advanced reliability metrics

Apart from traditional reliability metrics, Storm allows the computing of advanced dependability metrics. It categorizes metrics based on their complexity: Basic, Advanced, Importance, and Custom.
Basic
  • Reliability: the probability of failure within a given time bound.
  • Unreliability: the complement of reliability (1- Reliability).
  • Average failure probability per hour
  • Mean-time-to-failure: the expected time to system failure or scenario occurrence.
  • Event probability within a time bound: the probability that an event occurs within a given time.
  • Event probability: the probability that an event occurs.
  • Instantaneous probability: the probability that an event occurs at a given time.
Advanced
  • Full function availability (FFA): the time-bounded probability that the system provides full functionality, indicating it has neither failed nor degraded.
  • Failure without degradation (FWD): the time-bounded probability that the system fails without being degraded first.
  • Mean time from degradation to failure (MTDF): The expected time from the moment of degradation to system failure.
  • Minimal degraded reliability (MDR): the worst-case failure probability when using the system in a degraded state.
  • Failure under limited operation in degradation (FLOD_1): the probability of failure when imposing a time limit for using a degraded system.
  • Failure under limited operation in degradation (FLOD_2): similar to FLOD_1, but with additional conditions of avoiding prior system failure.
  • System integrity under limited fail-operation (SILFO): it considers the system-wide impact of limiting the degraded operation time, with aspects FWD and FLOD_1.
  • Reach-avoid probability: the probability of one event occurring without another event happening before.
  • Time-bounded reach-avoid probability: the probability of an event occurring within a time limit without another event happening beforehand.
Structure knowledge example
Importance
  • Birnbaum index (BI): it measures how much the system's unreliability depends on a specific component's unreliability.
  • Criticality importance (CI): similar to BI, scaled by the ratio of component and system unreliability.
  • Risk achievement worth (RAW): the impact of a component's total degradation on system unreliability.
  • Risk reduction worth (RRW): the impact of making a component fully reliable on system unreliability.
  • Diagnostics importance factor (DIF): the frequency of a component's failure in states where the system has failed.
  • BAGT+: the change in mean time-to-failure (MTTF) if the component fully degrades.
  • BAGT-: the change in mean time-to-failure (MTTF) if the component is fully reliable.
Structure knowledge example
Custom

Custom properties can be specified using Probabilistic Computation Tree Logic (PCTL) / Continuous Stochastic Logic (CSL).

The probability measure on Markov models is typically defined on paths. These paths are defined as in temporal logic, or more specifically computation tree logic (CTL), a branching-time logic. That means that the formula alternates over descriptions of paths and descriptions of states.

Path Formulae

For this, we assume that a and b are state formulae and {op} is any one of <, <=, =, >=, >. The available path formulae are:

  • a U b to describe paths on which at some point b holds and in all prior steps a holds.
  • F b as a shortcut for true U b.
  • a U{op}k b (where k is an expression evaluating to a number) to describe the paths on which b holds within k time (where time in discrete models means steps) and a holds before.
  • F{op}k b as a shortcut for true U{op}k b.
  • G a to describe paths on which a holds in every step.
State Formulae

Here, we assume that a and b are state formulae, phi is a path formula and {op} is any one of <, <=, =, >=, >. The available state formulae are:

  • c where c is either a label or an expression over the model variables.
  • a | b, a & b to describe all states that satisfy a or b, a and b, respectively.
  • !a to describe the states not satisfying a.
  • P[{op}]t [ phi ] (where t is a threshold value) to describe the states in which the probability to satisfy phi conforms to the comparison {op} t.
  • LRA[{op}]t [ a ] to describe states in which the long-run average probability to be in a state satisfying a conforms to {op} t.
Obtaining Probabilities

Although formally not allowed in PCTL/CSL, one can also request the probability of fulfilling a path formula from each state. Instead of comparing to a given value P{op}b [ phi ] , one can write P=? [ phi ] to obtain the actual values rather then obtaining a truth value.

Nondeterministic Models

For nondeterministic models, the formula can (and sometimes needs to) specify whether it refers to minimal or maximal probabilities. Since there is no information on how the nondeterminism in the models is to be resolved, Storm needs information on whether it should resolve the choices to minimize or maximize the values. That is, you cannot write P=? [F a], but have to either write Pmin=? [F a] or Pmax=? [F a]. While you can also specify min and max when comparing to a probability threshold, it's not necessary to do it. By default, if the comparison operator {op} is < or <=, then the probability is maximized and otherwise minimized. The reasoning is the following: if the property holds in a state, then no matter which resolution of nondeterminism is taken, the probability will always be below (or equal) to the threshold value.

Graphical Interface for first-time users and experienced users

The tool provides a drag-&-drop interface to model fault trees graphically, specify and verify measures of interest, plot results, and do step-by-step simulation of fault trees. Advanced users can use features like specifying custom properties, characterizing complex system behaviours (states using Boolean equations) and quantifying their probabilities.

Structure knowledge example

BDD, Markov and hybrid analysis of complex systems

Fault trees are a key model in reliability analysis. Classical static fault trees (SFT) can best be analysed using binary decision diagrams (BDD) whereas state-based techniques are favorable for the more expressive dynamic fault trees (DFT). We combine the best of both worlds by following Dugan’s approach: dynamic sub-trees are analysed via model checking Markov models and replaced by basic events capturing the obtained failure probabilities. The resulting SFT is then analysed via BDDs. Our implementation of Dugan’s approach significantly outperforms pure Markovian analysis of DFTs.

Structure knowledge example

Exact analysis of dynamic systems using probabilistic model-checking

Complex systems usually have dynamic behaviour because of e.g. spare components, failure sequence among components, functional dependencies, etc. The analysis of such systems is usually quite complex which is usually based on simulation or generalization techniques. Unlike others we implement formal verification techniques e.g. probabilistic model-checking, and thus provide exact results on measures of interest. For systems having large state space, we provide an iterative analysis approach providing upper and lower bounds on the exact values of measures as discussed below.

Structure knowledge example

Sound-bounded analysis for dynamic systems having very large state-space

In order to compute exact results for measures, first the full state space is constructed, and then analyzed. However, many states in the state space only marginally contribute to the result. If one is interested in an approximation of the MTTF (or the reliability), these states are of minor interest. Storm provides an approach that generates the state-space on-the-fly, and then compute an upper and a lower bound to the exact results on a partially unfolded system, which might be much smaller as compared to the fully unfolded system. The approximation is sound ensuring the exact result lies between these two bounds.

Structure knowledge example

Graphs on (advanced) measures

Reliability measures help figuring out optimal maintenance schedules of systems thus reducing their downtimes and saving cost at the same time. Fault trees that model sub-systems of systems can even predict their health individually thus helping make even more detailed maintenance schedules. We provide a graphical interface to plot and compare measures of interest e.g. reliability of different sub-systems, which is helpful in deciding maintenance schedules.

Structure knowledge example

Understanding semantics of all DFT gates through graphical simulation

The idea is to interactively visualize a sequence of failures in a DFT. The user would start with a usual DFT and could select one of the basic events (BE) that should fail first. Based on this, the status of each DFT element (failed, operational, fail-safe, claiming in SPAREs, etc.) is redetermined and then visualized. Afterwards, another BE can be selected to fail and so forth. The main benefit of this feature is that the semantics of all gates of DFTs become much clearer to undertand as users can try out the behaviour by themselves.

Structure knowledge example

Automatic simplification of large fault trees before analysis

Fault trees are a popular industrial technique for reliability modelling and analysis. Their extension with common reliability patterns, such as spare management, functional dependencies, and sequencing — known as dynamic fault trees (DFTs) — has an adverse effect on scalability, prohibiting the analysis of complex, industrial cases by, e.g., probabilistic model checkers. Storm makes use of reduction techniques for DFTs. Experiments on a large set of benchmarks show substantial fault tree simplifications, yielding state space reductions and timing gains of up to two orders of magnitude.

Structure knowledge example

Scalable analysis of large systems using modularization

It allows evaluating subsystems individually and simplifying the large systems into smaller ones. It helps analysing large fault trees in an iterative way. Moreover, the rendering of large fault trees on canvas sometimes does not give a true picture/understanding of the underlying fault model. We, therefore, allow interactive breakdown of large fault trees into independent modules, static or dynamic, organized in a hierarchical manner. This improves the readability of the model and allows verification of metrics on individual models easily.

Structure knowledge example

Model-based safety assessment (DFTs extraction from SysML v2 models)

Storm automates model-based risk assessment (MBRA) in parallel with model-based systems engineering (MBSE). By annotating safety aspects (e.g. redundancy, functional dependencies, failure ordering, etc.) in SysML 2.0 models, aur algorithm automatically extract relevant DFTs out of them. This reduces a lot of effort required in building DFTS manually from SysML 2.0 models.

Structure knowledge example

Parametric fault trees and event trees & (empirical) failure distributions

Model parameters can be provided in the form of constants, real expressions, and failure distributions. Failure distributions can be specified manually or evaluated from data sets that are generated during system operations. Furthermore, weighted failure distributions are also supported, allowing combining two or more failure distributions into one failure distribution. For example, combining failure distributions from international reliability standards with empirical distributions (calculated from field data) allows for having more meaningful distributions for system analysis in production.

Event trees embedded with dynamic fault trees

We extend classical event trees with non-deterministic choices and decision-making at states and allow the addition of state rewards and/or losses. Moreover, DFTs can be embedded into RETs and provide transition probabilities (of RETs). By analyzing RETs, one can determine

  • Expected gains or losses, such as radioactive leakage, fatalities, etc.,
  • Max/min limits on the frequencies and probability of the outcomes in event trees, and
  • Wise choices to, for example, lessen the unfavorable effects/outcomes.
Structure knowledge example

Powered by Storm model-checker as the backend computational engine

The Backend Computational Engine Storm is powered by [Storm] -- a state-of-the-art probabilistic model checker. Storm is a tool for the analysis of systems involving random or probabilistic phenomena. Given an input model and a quantitative specification, it can determine whether the input model conforms to the specification. It has been designed with performance and modularity in mind. Storm interacts with the DFT module of Storm -- storm-dft -- using a Python binding [stormpy] and utilizes the rich features of [diftlib] library.

Structure knowledge example

Storm is validated against a DFT benchmark

The Storm tool has been validated against multiple fault trees in the [FFORT fault tree forest], a DFT benchmark suite maintained at University of Twente. FFORT is a collection of fault trees gathered from scientific literature and open industrial reports. One can find the analysis results for the fault trees verifiable by our tool in the suite in comparison with other tools (if any).

Structure knowledge example

Application Domains

Image 1
Automotive
Image 2
Aviation
Image 3
Robotics
Image 4
Intelligent Systems
Image 5
Medical
Image 6
Defense
Image 7
Nuclear
Image 8
Renewable Energy
Image 9
Oil & Gas
Image 10
Construction

Industrial Partners

research-student

Academic Partners

13+

Partners

15+

Projects

4+

Happy Clients

30+

Meetings

Lets start the journey

Basic

  • Free for academia
  • Fault tree analysis module
  • Event tree analysis module

Enterprise

  • Fault tree analysis module
  • Event tree analysis module
  • Markov analysis module
  • Integration among modules
  • User management & workspaces